project highlights
Please see GitHub for detailed code.


social media network plot
Generated an artificial social network and created a community membership matrix, connected probability matrix, adjacency matrix, and network plot to model connections. For the network plot, analyzed expected and observed number of members for each sub-community.
Language: Python
Libraries: seaborn, matplotlib, numpy, networkx

relating meat consumption and CO2 emissions
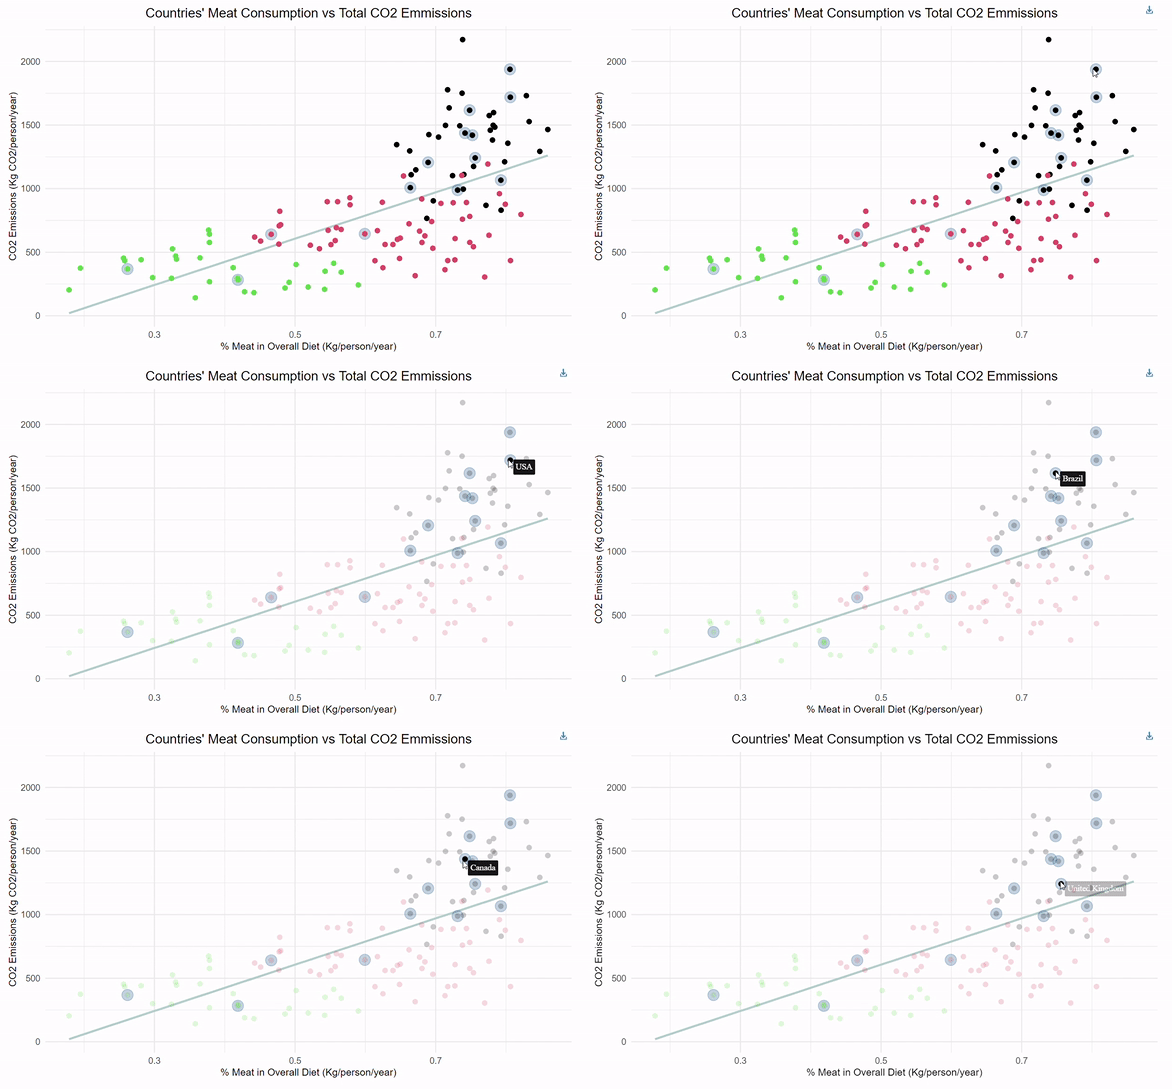
Designed a linear regression for predicting a country's CO2 emissions given the percentage of meat consumption. Implemented k-means clustering to group countries based on interpretable ranges of CO2 emissions. Incorporated interactive functionality within ggplot to highlight top-GDP countries for added dimensionality.
Language: R
Libraries: ggplot

cost + schedule risk dashboard
Aggregated 42 discrete multi-million-dollar cost models into a cost summary database to track and visualize summaries for internal and client use. Data was used as the foundation for 3+ long term client deliverables (12+ months) and used to support a cost summary dashboard for client and stakeholder use.
Language: PowerBI, Excel

who knows who?
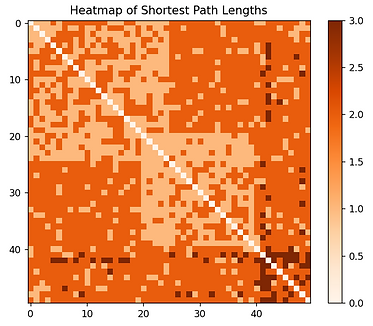
Created an adjacency matrix for a sample social network in order to identify closest neighbors via Floyd Warshall algorithm. Further analyzed common neighbors and similarity among members via Jaccard similarity scores and Adamic Adar indices. Visualized findings via heatmaps.
Language: Python
Libraries: pandas, matplotlib, numpy, scipy, sklearn, networkx

salinity tolerance in common biofuels
Analyzed 30,000+ genes in P. hallii, a lab-friendly alternative to the common biofuel Switchgrass, to test for resilience to extreme conditions, specifically high salinity tolerance. Separated primer sequences within P. hallii DNA and filtered low quality data based on visualizations for each sample. Findings used to support a graduate thesis.
Language: Python, R
Libraries: ggplot

beating wikiracer
Designed an algorithm to find the shortest path between two pages in the Wikipedia using DFS, BFS, Dijkstra's, and A*.
Language: Python
Libraries: pandas, urllib, collections

boggle
Designed a randomly generated boggle game board with an interactive user interface and a correct backend answer key. Implemented BFS and DFS search methods, hash mapping, and trie dictionaries to find all valid words on each unique boggle game board to support the correct backend answer key.
Language: Python
Libraries: collections, numpy

how does a city's size affect poverty?
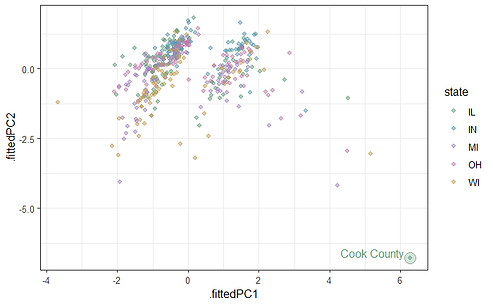
Performed a PCA of an external dataset across 2 components. Plotted PC1 and PC2 and checked for outliers. Incorporated interactive functionality with ggplot to highlight counties and enhance interpretability within clustered data.
Language: R
Libraries: ggplot, colorspace

movie review sentiment classifier
Designed a neural sentiment classifier that trained a model of 6000+ movie reviews in order to predict positive or negative sentiment for an unlabeled test set. Used both perceptron and logistic regression for training, as well as unigram, bigram, and n-gram for bag of words vectors.
Language: Python
Libraries: torch, numpy, nltk

mario kart image classifier
Designed an convolution neural net to classify Mario Kart screenshots into 6 classes based on a training set of 21,000 images. Logged training loss at every iteration and the training and validation accuracy at each epoch in order to optimize hyperparameters (e.g., type of loss function, learning rate, number of layers, d_model size).
Language: Python
Libraries: torch, numpy

transformer language model
Designed a transformer, both from scratch and using the torch.nn built in transformer, that predicted the next letter of a phrase given some/no context. Optimizations to enhance performance included adding batching and fine tuning hyperparameters (e.g., type of loss function, learning rate, number of heads in multi-head attention, number of layers, d_model size).
Language: Python
Libraries: torch, numpy
who wrote this blog?
Classified a blog’s political orientation based on its connection within a blog citation network. Compared various clustering techniques, including k-means, hierarchical, mean shifting, and spectral (ultimate choice).
Language: Python
Libraries: pandas, urllib, collections